Feb 8 2019
Using Artificial Intelligence and Big Data methods, scientists from Valencia University (UV) have created the first global maps of the nitrogen and phosphorus contents in vegetation, as well as the efficiency in water usage. The general belief is that the application of these maps will have a significant influence in fields such as agriculture, biodiversity, or the adaptation of species to climate change.
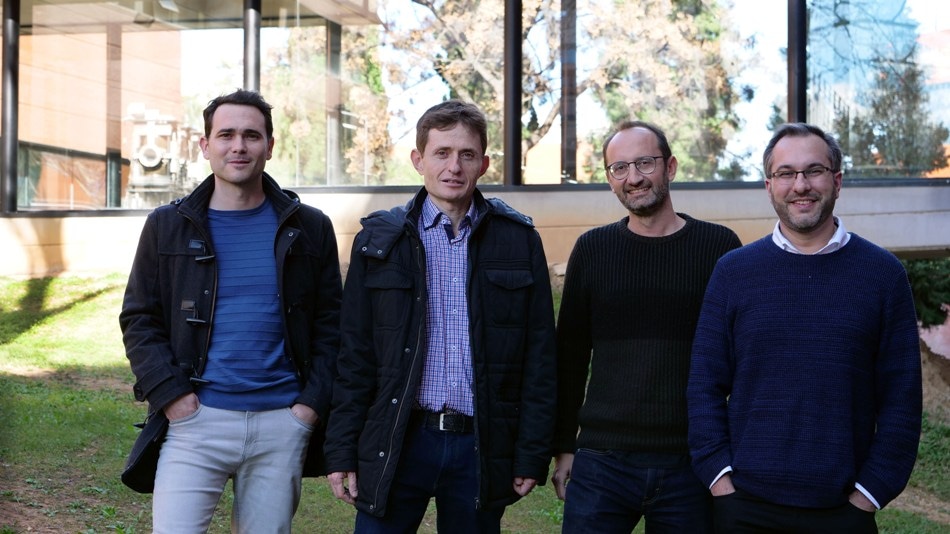
 (image credit: RUVID)
Artificial Intelligence (AI) methods along with the support of Google to work with Earth’s mass satellite observation data, have made it feasible to create the first global maps on vegetation variables that up to now were only available locally.
A study team of the Image Processing Lab (IPL), of the University’s Scientific Park, and of the Environmental Remote Sensing (ERS) Group of the Department of Earth Physics and Thermodynamics, both of the UV, have formulated a methodology to create global maps of core parameters, variable, and features of the Earth’s vegetation. The technology, based on AI, works with Google’s cloud to make the most of the numerous images from the NASA and the ESA, thus enabling the generation and monitoring of the vegetation with high temporal and spatial resolution in a global manner. The studies have shown very remarkable patterns in core parameters to examine climate change, such as nitrogen or phosphorus contents and plant foliage.
“Until now it was impossible to produce these maps because the required conditions weren’t available. We didn’t have powerful and accurate machine learning statistical tools; nor did we have access to great bodies of data or cloud computing to process the petabytes of satellite images in a fast and accurate way. Now, with the Google platform and the AI techniques, we can make these calculations with data from the ESA or NASA quickly and on a planetary scale,” says physician and electronic engineer Álvaro Moreno, leader of this research and current researcher of the IPL for the Image and Signal Processing (ISP) group.
The scientists have accomplished the data processing in the Google cloud.
The mathematical tools are machine learning models that learn the relation between the images they receive from the satellites and the measurements taken from the Earth’s surface. Once they have learned this relation for numerous observation-measurement pairings, this knowledge can be extrapolated to any other location and time to generate estimation maps of the measure of interest. The possibilities are tremendous and now we can generate global maps from almost any variable of interest where there is in situ data, as we have the satellites orbiting and providing very good temporal and spatial observations. In our case, we have generated global maps of biophysical parameters that are useful to monitor vegetation (how much vegetation we have, to what extent it’s active and what amounts of phosphorus and nitrogen there are), but they could very well be used for other variables of interest, and not only on the ground, but also in water and as regards the quality of air.
Manuel Campos-Taberner, Researcher, ERS.
For more than 15 years the researchers have been taking part in related initiatives with the European Organization for the Exploitation of Meteorological Satellites (EUMETSAT) for the utilization of data from current and future missions within a European program called Satellite Application Facility on Land Surface Analysis (LSA-SAF).
It is the first European initiative dedicated to producing and distributing, in real time, variables of the status of the terrestrial environmental system, offering products of great value for the observation of the climate and the environment.
Javier García Haro, Chief Investigator, ERS group.
Future applications
According to the researchers, the new maps will have an effect in other fields such as biodiversity, precision farming, or the adaptation of species to climate change. “The study is not only a conceptual test of what can be achieved by combining machine learning and remote sensing, but it also opens the door to future scientific studies that exploit this type of maps,” adds Gustau Camps-Valls, Electronic Engineering professor and researcher of the IPL, who has the support of an ERC Consolidator Grant for the development of AI concerning the observation of the Earth. “The applications and implications are endless, and even more so when faced with the current pressure on food and biofuel production for example, without underestimating the study of the impact on ecosystems and the adaptation of species,” he concludes.
The study team from Valencia University has formulated the methodology along with researchers from over 20 institutions from around the world (Max Planck, UCL, Univ. Montana, Univ. California, etc.), with the partnership of Google’s “Google Earth Engine” and the data from multispectral sensors of the NASA from the past two decades. Steven W. Running (University of Montana), lead author of the Fourth Assessment Report of the Intergovernmental Panel on Climate Change (IPCC), which earned him the Nobel Peace Prize in 2007, was involved in these studies. “What Álvaro Moreno and his collaborators have done is impressive— he says—; now, with a computer connected to the internet, you can do things that the ESA or NASA have never done in their 50 years of existence.”